

The hardest thing about ops
Defining the right KPIs is hard. It is also crucial to operations. We try to understand and measure a business as a whole. Without the right KPIs we make decisions based on wrong data. And we’ll never understand why revenue goes up or down. So you have to get your KPIs right.
Ops is often the only team not thinking in silos like marketing, sales, or account management. So it is natural that defining the right KPIs falls to us. Today we are talking about how to approach that challenge.
There are two angles of attack: top-down or bottom-up. Both have their advantages and disadvantages. Pick one and follow it through. But sketch out the other to see whether you arrive at the same result.
The goal is to find a set of primary KPIs that explain the outcome of the business. And for all employees to know which KPI they help improve.
Top-down: From targets to KPIs
This approach works best if there are clear company goals and targets. Before we dive in, the difference between a goal and a target ist important. A goal is something you want to achieve, for example revenue growth. A target quantifies that goal (similar to the OKR system).
Let’s say your goal is to become profitable. Your business becomes profitable when it hits $500,000 in revenue per month, so that is your target.
The rest is simple arithmetic. Start with your average contract size (ACV). If your ACV is $10,000, you need 50 deals per month ($500,000 / $10,000) to become profitable.
But not every opportunity results in a deal. Let’s assume that only 1 in 10 leads to a signed deal. That is your conversion rate (CVR). Here, your CVR is 10%. So you need 50 deals / 10% = 500 opportunities per month.
The math is the same regardless of how long your sales cycle is. Assume you close deals on average within three months. You still need 500 opportunities this month to be a profitable business in three months.
With that very simple logic we have identified three KPIs to improve:
Number of opportunities
Conversion rate
Average contract value
Improving any one of them will increase your revenue. The formula is simple: Opportunities x Conversion Rate x Average Contract Value = Revenue.
The question for you is now: What team works to increase the number of opportunities? Who is in charge of improving the conversion rate? And who can help expand the average contract value?
Applying the top-down method to other business processes
We can apply the top-down method to other quantifiable business processes. Say you want to expand your sales team by ten new employees in six months (the “target”). HR can tell you how many candidates they invite for interviews (the “number of opportunities”). Assume you had to invite 15 candidates per position. Also, we can fill each position only once. Then your CVR is 1 position / 15 candidates, so about 6,7%.
In total HR has to invite 150 candidates (= 10 positions / 6.7%) for interviews to fill all 10 positions.
We can generalize the formula to input x conversion rate x average output = target. By rearranging the equation we can calculate the missing variables.
Bottom-up: From KPIs to target
Setting KPIs is easier if you know what target you are optimizing for. However, sometimes it is difficult to come up with a reasonable target. You might not have enough data or are just starting out.
Too high and the target quickly becomes unrealistic and even demoralizing for your team.
If the target is too low you don’t find out what process is working. A bad process might still be just enough to reach the goal. If the target is connected to commission or bonus payments, you might also overpay. That’s because reaching your target becomes too easy for your team (we'll look at commission-based compensation in a future post).
How do you solve that problem? You need to become a scientist of your own company. Start by drawing the process which you want to set a target for. Say you want to set up a new inbound sales team. The team's process looks something like this:
Lead fills out a form on your website
An SDR checks if the lead is credible (right industry and seniority) to warrant a call with an AE
AE sets up a meeting
After the meeting has taken place, the AE sends out an offer
Client signs offer
You start by investigating how many leads fill out the form every month. Then you look up how many meetings were set from those inbound leads. Of those meetings, how many took place? How many offers were sent out afterwards, and how many of those offers were signed?
Here’s an example table:
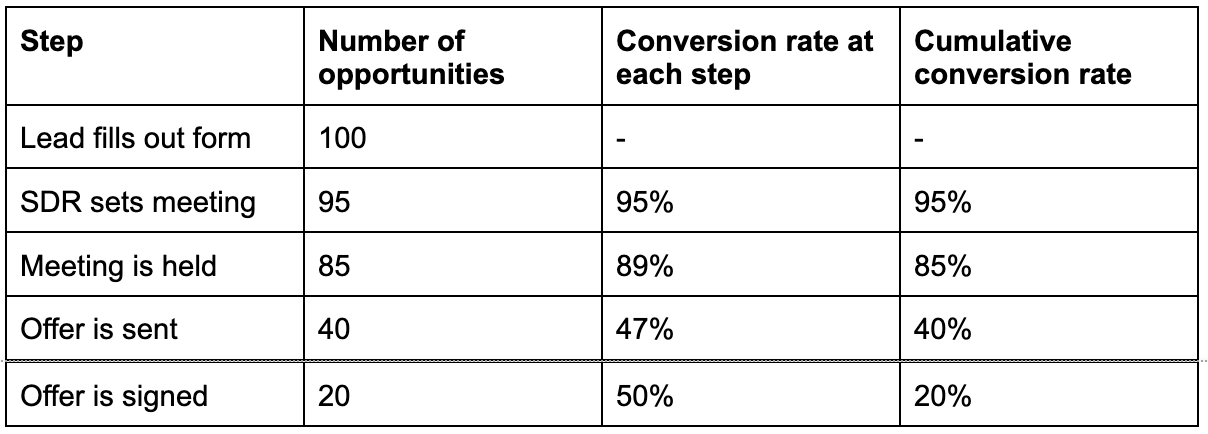
You now have conversion rates for each step. You also have a cumulative conversion rate that tells you how many leads you need per deal. In this case the number is 100 opportunities x 20% = 5 leads per deal.
Armed with these numbers, you can now set a target for your new inbound team. Assume that the average deal size is constant at $10,000. You know the number of opportunities (100) and your CVR (20%). Calculate 100 opportunities x CVR of 10% x ACV of $10,000 = $100,000 – that’s your target.
😈 in the details
That’s it! Both approaches sound simple but you need to be careful. Make sure your model reflects the real world at least to some extent. To model more complex processes, add more steps with conversion rates. Good luck!
tl;dr
Top down:
Work backward from your target
Target = ACV x CVR x opportunities
Determine team that's responsible to improve each KPI
Can be used for any quantifiable process
Bottom up:
Draw process
Investigate each process step (“become a scientist of your own company”)
Opportunities x CVR x ACV = target
Determine team that's responsible to improve each KPI